Графики и таблицы пример 9
08.19.2021 17:50
Этот пример описания линейного графика сравнения количества угнанных автомобилей в разных странах.
Здесь необходимо ясно описать график с выделением основного тренда и сделать сравнение.
Посмотрите, как это было сделано в примере.
You should spend about 20 minutes on this task.
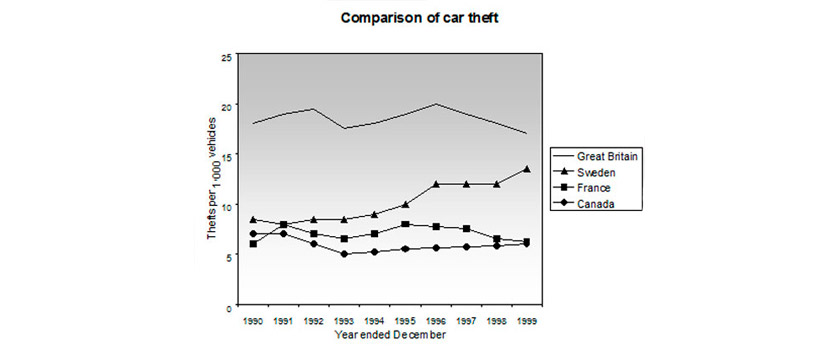
The line graph shows thefts per thousand vehicles in four countries between 1990 and 1999.
Summarize the information by selecting and reporting the main features and make comparisons where relevant.
Write at least 150 words.
Line Graph Examples - Comparisons of Car Theft
IELTS Line Graph Examples - Model Answer
The line graph compares the number of cars stolen for every 1000 vehicles in four countries from 1990 to 1999. Overall, it can be seen that car thefts were far higher in Great Britain than in the other three counties throughout the whole time frame.
To begin, car thefts in Sweden, France and Canada followed a fairly similar pattern over the first five years, all remaining at between 5 and 10 per thousand. The general trend though for France and Canada was a decline in the number of vehicles stolen over the period, with both at around 6 in 1999. In contrast, Sweden experienced an upward trend, starting the period at approximately 8, and finishing at just under 15.
Interestingly, car thefts in Great Britain started at 18 per thousand, which far exceeded that of the other countries. It then fluctuated over the next nine years, reaching a peak of 20 thefts per 1000 in 1996, and ending the period slightly lower than where it began, at approximately 17 per thousand.
(Words 174)
Пояснения к примеру
Вступление начинается с обзора (описания) ключевых сведений представленных линейным графиком и ясного описания основных тенденций.
Первый параграф посвящен описанию Швеции, Франции и Канады, так как они их изменения сравнительно похожи. Великобритания была описана во втором параграфе потому что ее данные по количеству угонов сильно отличаются от данных других стран.
Организация описания графика данным образом делает текст читабельным и показывает что автор может выбирать основные позиции графика для сравнения.
